They may lack the sweep of a novel, the pathos of a play or the beauty of a poem, but the facts and figures collected through the census tell us a great deal about ourselves, and about the generations who came before us.
Just ask Steven Ruggles, a historical demographer at the University of Minnesota who has built a career deciphering census data to trace the history of the family in the Western world. By mining public records, Ruggles can learn how family structures have changed over time: who and when people marry, when they have children, where and how people live, the ways people make a living.
In recent years, easy access to digitized records has turbocharged the work. As director of the Institute for Social Research and Data Innovation at his university, Ruggles launched the world’s largest database linking census records and other historical data in 1993. Known as IPUMS, the collection tracks US Census data from 1790 to the present, as well as data from more than 100 national statistical agencies around the world, and a variety of other archives.
IPUMS is one of the first databases to track individuals over time and across locations — a goldmine for demographers and many other sorts of scholars, says Ruggles, who appraised the future of historical demography in the 2012 Annual Review of Sociology and, with coauthors in the same journal, detailed in 2018 how demographers are trying to link census records. “That’s what’s really becoming a huge deal in the world of historical demography,” he says.
In 2021 alone, thus far scholars around the world using IPUMS have published papers on maternal health, tobacco control, rental affordability and demography methodology. Ruggles told Knowable why digging into these sorts of data is so tantalizing for demographers. This conversation has been edited for length and clarity.
Why assemble this massive trove of demographic data?
In the 1970s, I was interested in the impact of demographic change on family composition. There was this enormous demographic transition starting in the 19th century, where mortality fell and then fertility fell. The world was transformed by it.
I wanted to study what that shift meant for family living arrangements. Earlier, in the 16th or 17th century, people had lots of kids but married really late. Most people died before their grandchildren were born, so the potential for multigenerational families was sharply constrained. It exploded later on, when “corporate families” — patriarchal family systems based on land or business ownership — became the norm.
Of course you couldn’t really measure this with the data that existed, which were fragmented — reports on census materials, compiled by demographers working on their own, for individual towns in isolated years. So I started out working with microsimulations: demographic models that let you construct and build up virtual populations with known behavior over time, keeping track of all the relationships.
That’s where I started, but I got disillusioned with demographic modeling. You can only take it so far. So in the ’80s I started working on historical data collection, and I’ve been doing that ever since.

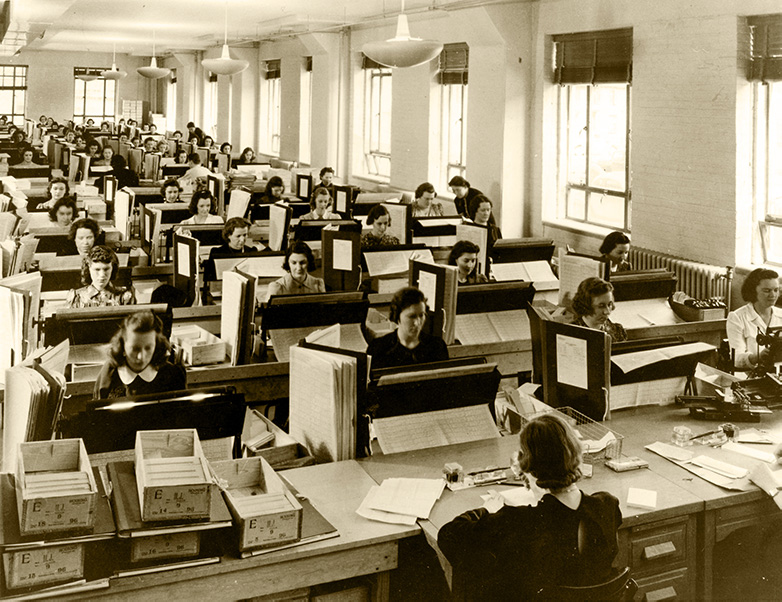
Keypunch operators enter data for the 1940 US Census. Historical demographers depend on census reports, among other records, to understand population changes over time. Linking records — across generations, or with other data such as military records — opens a wealth of new research possibilities.
CREDIT: US CENSUS BUREAU / FLICKR
What kinds of data do you collect and disseminate?
It’s individual-level US Census data, which at a basic level includes the answers every American family submits for census surveys every 10 years. Individual data from the 1950s onwards are all guarded within the Census Bureau because of confidentiality rules, but earlier reports are publicly accessible. We have recovered and organized access to similar records for a bunch of other countries, too — in all, 109 national statistical agencies. The only big countries we’re missing are Japan and Australia, where we are still trying to persuade them to share.
What information is included in individual-level census data?
It varies. Your typical census collects information about household size and composition, and also about work, occupation, hours worked, weeks worked last year and educational attainment. Often there’s information about housing, too — what kind of plumbing a family has, what their house’s walls and the roof are made of, what they use for cooking fuel, that sort of stuff.
The cool thing is, all of the individuals enumerated in a census are nested into families, so you know relationships among the people — who is married and who is divorced and who is a parent and who is a child. This lets you construct additional variables to track, such as husband’s occupation or mother’s education, which might help you study how economic status relates to fertility, to cite an example.
Thanks to digitization, we now have easy access to these data spanning all of US history. What we’re trying to do now is link it all together — to trace people across generations and across their lives and see what happened to them. That’s a tremendously exciting new development.

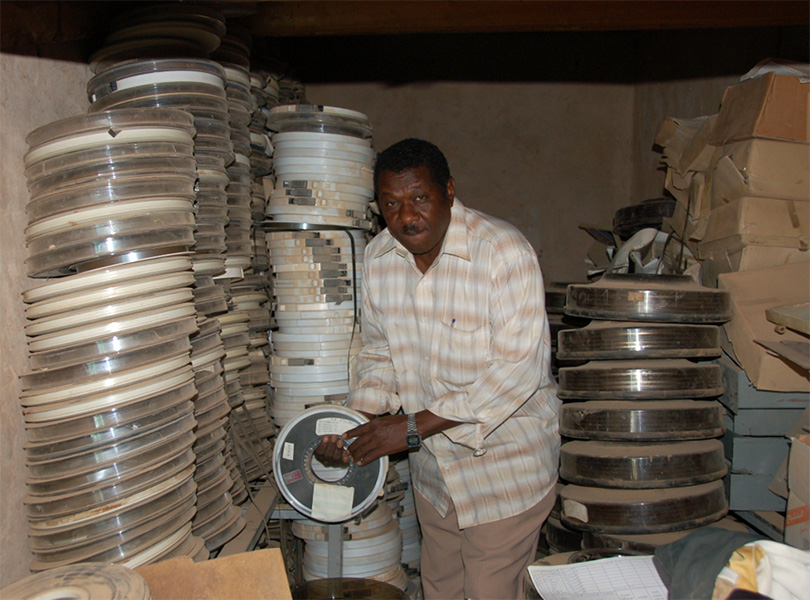
A staff member at the Central Bureau of Statistics in Khartoum helped IPUMS, the world’s largest collection of integrated population data, identify tapes storing data from the 1973 census of Sudan. IPUMS eventually managed to read most of the data on the tapes, but some were lost.
CREDIT: ROBERT MCCAA / IPUMS
What does “linking data” mean?
We’re talking about following individuals, through their census data, across their entire lives. Linking them to their parents, and then on to their parents throughout their lives — over many generations. We can follow the individuals in other sources, too, including administrative, Social Security and military records, as well as all kinds of smaller data sets from other parts of society, such as a company that collects extremely rich data on its employees.
When we first attempted record linkage in the early 2000s, we thought, well, we can’t link everybody, we’re just going to try to get a representative set. But now we’re going to try to link everybody. It will take me through the end of my career.
Is the process automated, or does somebody have to go through and tag everything?
It’s got to be automated, because we’re going to have a billion records. We don’t have that many research assistants!

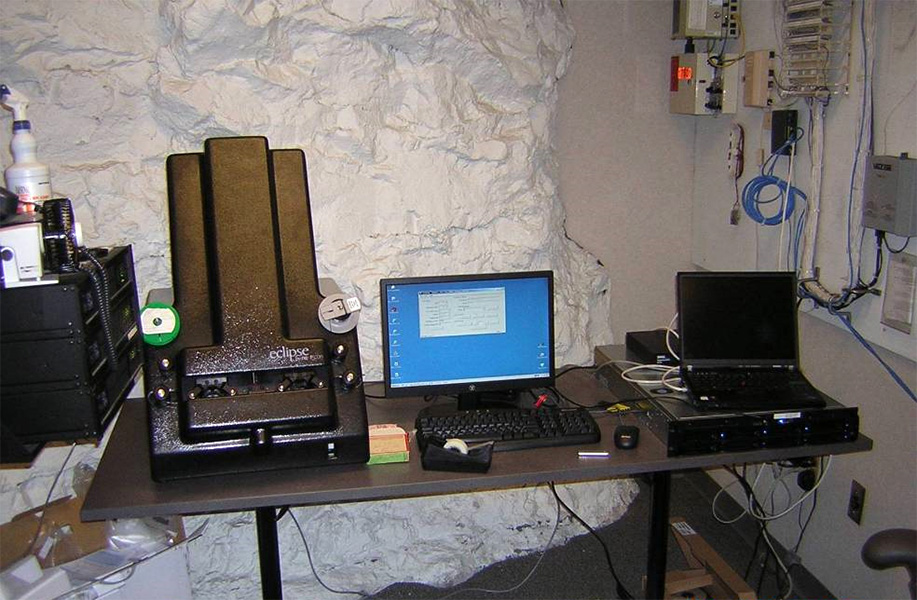
The US National Archives stores microfilm and old movies at remote sites including this cave in Lenexa, Kansas (cave wall visible behind workstation). Here, officials stored data from the 1960 census at 30 degrees Fahrenheit, on shrink-wrapped pallets. Researchers from the survey and records database IPUMS visited the cave when they restored lost data from the 1960 census.
CREDIT: J. TRENT ALEXANDER / IPUMS
What kinds of things do you study?
Right now, I’m working on a paper on race differentials in marriage since 1960. I developed a new way to measure age-specific rates of first marriage that can offer scholars a new look at the “male marriageability” hypothesis — the notion that the reason fewer Black couples marry is that there is a shortage of marriageable Black men.
The data show that in the 20th century, economic circumstances explain the difference in marriage rates. The gap is diminishing in the 21st century, and I think that’s a result of the declining importance of male work. Now the relative importance of other factors, like women’s income, is a much bigger factor.
You have studied women’s work throughout your career.
Yep. I argue that the rise of women’s employment is one of the key transformational events for family structure. In the 19th century, we had the corporate family, in which work was done on farms or other family enterprises, with or without slaves. The whole family was involved, and authority was vested in the senior male.
US census data and other records reveal dramatic shifts in family economies. The “corporate family,” for example — large familial units organized around a single business or farm — dominated for nearly a century, before giving way to households led by individual male wage-earners, and then dual-income couples and solo female breadwinners.
The first challenge to this order was the rise of reasonably paid male employment. With other opportunities, sons weren’t forced to stick around, and multigenerational families quickly eroded. Then male breadwinner families predominated, from 1930 to 1970. By 1980, female- or dual-income families surpassed 50 percent of married-couple households. Female breadwinner families are now a significant category.
You mentioned that people married late in the 16th and 17th centuries. I would have assumed that people always married young before the 20th century.
Romeo and Juliet is one reason why people think that. Except that Shakespeare wasn’t writing about his own period in history, when marriage age was at its highest. He was writing about an exotic, old Italian place where he imagined that people married very young.
The truth was, they didn’t. In the European family system, you had to have some land, and a way to support your family, before you could get married, so it tended to be fairly late. At the end of the 17th century, the median marriage age in England was 27 for women, and maybe 29 or 30 for men.
What’s the median age of marriage today?
Historically you can measure actual marriage age, but you can’t do it for the present. We don’t know how late people today are going to marry because they aren’t done marrying yet. We will know only after everybody is dead and gone.
As an estimate, though, among white women the median right now is around 29 years. For men it’s just a year or two older. It’s later than ever before, certainly in American history, and it’s probably later than it was in northwestern Europe in the 1600s.
You also can project what portion of people are never going to get married. It may approach 40 percent by the time today’s 20- to 24-year-olds reach 45 to 54 years of age.
The age at which people marry has fluctuated over the centuries. In the US, census data show that marriage age for men and women hit a low in the 1960s and then shot up, reaching a new high today.
Is that a striking shift?
There are a lot of demographers who say people are just delaying marriage. But that’s never happened before, except in one cohort: the people who came of age during World War II. In all the other cohorts of the 20th century, the percentage of women married at 20 to 24 is an extremely good predictor of the proportion that ever get married.
Then again, I’m not really responsible for predicting the future because I’m a historian! So I could be wrong.
Obviously, these trends tell us something about history, and where we came from. Are there also policy implications?
The impact of economic factors on families has huge policy implications. Demography also has enormous potential to improve our understanding of health.
In recent years, partly because we have all these new data, there’s been a huge amount of research on the 1918 pandemic — its impact, and its long-running echo. People look at babies conceived during that pandemic and see what happened to them compared to people conceived right before and right after, and trace those outcomes over time. I imagine there will be far-reaching consequences for the Covid-19 pandemic as well (see sidebar: Demographers tackle Covid-19).
Is the research into the 1918 pandemic ongoing?
It’s been a real boom, fueled by the new data. Most of the demographers studying the 1918 influenza at our population center are looking at its impacts on work and family and poverty. Studying records linked to individuals who were very young in 1918 — including people in utero at the time — show that they carried scars for the rest of their lives: poor health consequences, lower educational attainment and less economic success.
Another really cool health study linked the 1930 census to selective service records from World War II.
The researchers here looked at people who were infants or very small children in 1930 and determined the acidity of the water supply in the neighborhoods where they grew up. This correlates with the amount of lead in their drinking water. When they also looked at the selective service records for each individual, which included IQ tests, they found that 20 percent of the variation in intelligence tests in 1945 could be linked to lead levels in the water supply from when they were children.
Now the same group is working on linking people who were children in 1940 to lead in the water to Medicare records, in an effort to see if there is an association between the lead levels and early onset Alzheimer’s disease. I’m sure using data like these to study Covid-19 will be a major source of doctoral dissertations for many decades to come. Eventually, that will become historical demography, too.


